Graphic Organizers and Implications for Universal Design for Learning: Curriculum Enhancement Report
Introduction
One way to help make a curriculum more supportive of students and teachers is to incorporate graphic organizers. Graphic organizers come in many types and have been widely researched for their effectiveness in improving learning outcomes for students with and without disabilities. This paper examines the research on educational applications of graphic organizers in grades K–12 and explores points of intersection with Universal Design for Learning (UDL), a curriculum design approach intended to lower the barriers that traditionally limit access to information and learning for many students. UDL is a theoretical approach that is based on research on the brain and effective teacher practices. UDL provides a framework for seizing the potential of digital technologies, including digital versions of graphic organizers, and using it to make the curriculum more flexible and supportive of diverse learners.
This paper begins with an introduction to graphic organizers (a definition, a sampling of different types, and a consideration of their curriculum applications) and a discussion of the research evidence for their effectiveness. The literature review addresses important questions about graphic organizers that are relevant to classroom practice, including whether graphic organizers are beneficial to students with disabilities and what instructional context makes them most effective. In the second part of the paper the discussion transitions to UDL applications of graphic organizers. This section develops an understanding of UDL and proceeds to identify ways that graphic organizers can support UDL at both the theoretical and teacher practice levels. The paper concludes with general guidelines for UDL implementation and a list of web resources that provide further information.
Definition
A graphic organizer is a visual and graphic display that depicts the relationships between facts, terms, and/or ideas within a learning task. Graphic organizers are also sometimes referred to as knowledge maps, concept maps, story maps, cognitive organizers, advance organizers, or concept diagrams.
Types of Graphic Organizers
Graphic organizers come in many different forms, each one best suited to organizing a particular type of information. The emergence of digital graphic organizers enable users to alternate between a text outline and graphic organizer view of the same information. The following examples are merely a sampling of the different types and uses of graphic organizers.
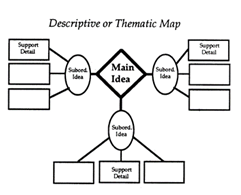
A Descriptive or Thematic Map, as shown above, works well for mapping generic information, and particularly well for mapping hierarchical relationships.
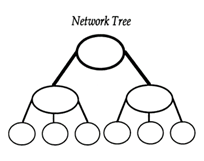
Organizing a hierarchical set of information, reflecting superordinate or subordinate elements, is made easier by constructing a Network Tree.
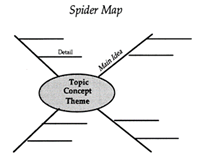
When the information relating to a main idea or theme does not fit into a hierarchy, a Spider Map can help with organization.
When information contains cause and effect problems and solutions, a Problem and Solution Map can be useful for organizing.
A Problem-Solution Outline helps students to compare different solutions to a problem.
A Sequential Episodic Map is useful for mapping cause and effect.
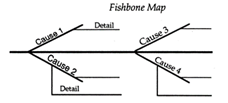
When cause-effect relationships are complex and non-redundant a Fishbone Map may be particularly useful.
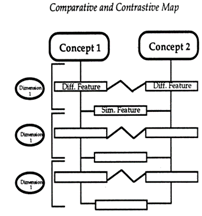
A Comparative and Contrastive Map can help students to compare and contrast two concepts according to their features.
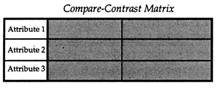
Another way to compare concepts’ attributes is to construct a Compare-Contrast
Matrix.
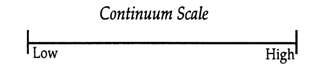
A Continuum Scale is effective for organizing information along a dimension such as less to more, low to high, and few to many.
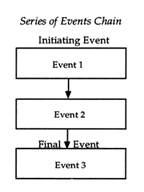
A Series of Events Chain can help students organize information according to various steps or stages.
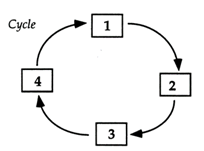
A Cycle Map is useful for organizing information that is circular or cyclical, with no absolute beginning or ending.
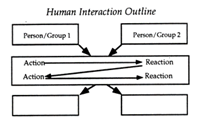
A Human Interaction Outline is effective for organizing events in terms of a chain of action and reaction (especially useful in social sciences and humanities).
Applications Across Curriculum Areas
Graphic organizers have been applied across a range of curriculum subject areas. Although reading is by far the most well-studied application, science, social studies, language arts, and math are additional content areas that are represented in the research base on graphic organizers. In these subject areas, graphic organizers have been shown to have benefits that extend beyond their well-established effects on reading comprehension (Bulgren, Schumaker, & Deshler, 1988; Darch, Carnine, & Kammenui, 1986; Herl, O’Neil, Chung, & Schacter, 1999; Willerman & Mac Harg, 1991; Canas, 2003; Novak, 2006; Ciullo 2013). Operations such as mapping cause and effect, note taking, comparing and contrasting concepts, organizing problems and solutions, relating information to main ideas or themes, and alternating between text outline and a graphic organizer view of the same information can be broadly beneficial.
Graphic Organizers and the Three Universal Design for Learning Principles
As a tool for teaching and learning, graphic organizers have unique affordances for optimizing the learning of all individuals. The following section looks at the foundational principles of universal design for learning—engagement, action and expression, and representation—how the needs of learners vary across the 3 UDL principles, and the ways in which graphic organizers can support diverse learners to complete different learning tasks.
Recognition networks
The UDL principle that focuses on the principle of recognition and focuses on offering multiple, flexible ways of presenting information when teaching indicates that no single representation of information will be effective for every learner. This UDL principle is further articulated into guidelines to help educators use graphic organizers to facilitate learning.
Graphic organizers come in many different forms and can offer teachers many ways to provide multiple representations of the same information. For example, a teacher could facilitate students’ understanding of cause and effect by developing concept maps of different examples or by using different types of maps (fishbone map, sequential episodic map, or problem and solution map) to map the same information about cause and effect. Because graphic organizers can be saved in a digital format, these multiple examples can be stored and accumulated for future use. Students can select the examples most effective for them. Teachers can also use graphic organizers as an alternative means to highlight the critical features of a pattern. Story grammar maps are an example.
Students vary in their ability to perceive and comprehend information in different media and formats. Graphic organizers, which can incorporate not only text but also multimedia, provide an alternative to speech and linear text that may be preferable to some students. The geometric shapes used in some graphic organizers may help some students to better visualize patterns. Making graphic organizers available increases the odds that a student can find a format and medium that are accessible and useful to him or her. And within the broad class of graphic organizers there are a whole variety of formats to choose from. Even students for whom access is not a problem will benefit from the redundancy of mixed media and formats as they can foster deeper understanding of a pattern’s essential characteristics.
Another way that graphic organizers can help to minimize barriers to recognition network-related learning is by activating background knowledge. What students learn is partly a matter of what they already know. Graphic organizers can help students to make connections between existing knowledge and new knowledge. They are a good complement to familiar ways of supporting background knowledge such as linear text. And because they are digital they can be built into reading and other material, enabling students the choice of accessing a whole variety of information when and as is best for them.
Strategic Networks
The UDL principle related to the strategic network focuses on providing multiple means of action and expression and recommends that educators offer multiple, flexible options for physical action, expression, and communication and executive functions. Students have different strengths and weaknesses in these areas. Graphic organizers can be used to instruct and to support students to act skillfully and develop into strategic learners.
Completed graphic organizers can support the UDL guideline provide options for physical action by scaffolding students’ interaction with information. For example, a completed digital diagram of an ecosystem can serve as an alternative to a physical model, an audio explanation, or a text description. Students can also traverse through and manipulate the digital diagram to explore and learn about an ecosystem.
Graphic organizers can support the UDL guideline provide options for expression and communication simply by being made available to students as an option for demonstrating their knowledge and skills. Instead of a traditional written composition, students can use graphic organizers to create visual representations that show their knowledge of a topic. Different types of graphic organizers offer students the flexibility of putting together text in a nonlinear format, organizing a collection of images, or developing a multimedia display. On the other hand, if the goal is to develop knowledge and skills in writing, placing writing steps and elements of structure of an essay into graphic organizers can scaffold and support students in starting a first draft. Students’ writing performance can be further supported by providing partially completed graphic organizers or links to additional resources about writing elements and models.
Graphic organizers can also be a tool for planning and managing information and resources. For example, while conducting research on a topic, students might use graphic organizers to gather and organize evidence. They might alternate between a graphical display and a text outline of their work to help them generate ideas and make a plan before drafting. Different types of graphic organizers and their unique features can be varied to provide supports that match individual student needs and specific writing tasks.
Affective Networks
The UDL principle related to the affective network focuses on providing multiple means of engagement and recommends that educators provide options for recruiting interest, sustaining effort and persistence, and self-regulation. Students vary widely in what motivates and sustains their engagement in completing different learning tasks across different contexts. As a tool for learning and creating, graphic organizers have inherent flexibilities that make them suitable for engaging all learners.
Students differ in their preferences and interests and graphic organizers can be used to offer students a choice of tools to complete learning tasks. The freedom to select tools based on personal interests and strengths can help maintain a good level of interest and even re-engage learners. Moreover, when working with graphic organizers students can select from different media (text, images, multimedia) and formats.
Graphic organizers can also be used to vary demands and resources to optimize challenges during a learning task. Scaffolds can be flexibly accessed to ensure that each student is working at an appropriate level of difficulty. Similarly, by varying the availability of scaffolds and other built-in forms of structure, students have access to varied learning contexts—increasing the chances that they will find one suitable to them, be it highly or minimally structured.
Examples
In the above section, we have highlighted the many ways that graphic organizers support the three UDL principles and align with UDL practices. In this section, we go one step further, showing that graphic organizers work not only in theory but in practice as well. We highlight the ways that graphic organizers are used to implement UDL practices. For this example, we identify general UDL features in the existing lesson and then highlight ways that graphic organizers could be used to make the lesson even more accessible and reduce lingering barriers.
As the Tide Turns: Radio Broadcasts from the Front, a sample lesson plan from SAS inSchool’s Curriculum Pathways.TM One of the main elements of this lesson plan, which is focused on building an understanding of crucial World War II battles, is to use a graphic organizer to plot the course of an important military turning point in the war.
This lesson is consistent with UDL principles and teaching methods in a number of ways (see Table 2). Through clearly stated goals and the use of digital materials such as the Internet, audio files, and graphic organizers; a good amount of flexibility has been injected into the lesson, helping to minimize barriers. There are yet additional ways to minimize barriers in this lesson using UDL teaching methods and graphic organizers. In Table 3, we give some examples of how the UDL features of graphic organizers can be used to further improve this lesson’s capacity to reach all students. Note that we are not making generalized recommendations for making this lesson more accessible but instead are focusing on ways that graphic organizers, specifically, can help achieve this goal.
Table 2. Existing UDL Elements in “As the Tide Turns: Radio Broadcasts from the Front” Lesson Plan.
UDL Guideline/Checkpoint |
Supportive Lesson Feature(s) |
Provide multiple examples. |
The teacher provides multiple web resources for each battle. |
Provide multiple media and formats. |
The teacher provides suggested web resources that offer text, images, and audio. |
Provide opportunities to practice with supports. |
The teacher scaffolds the research process by providing suggested web resources. |
Offer flexible opportunities for demonstrating skill. |
Students have the opportunity to create a graphic organizer, write a news broadcast, or produce and record a news broadcast. |
Offer choices of content and tools. |
Students can choose which graphic organizer to use. Some students are permitted to choose a task to complete and the tools with which to do so. The lesson plan leaves open the possibility of working with a digital or hard copy version of the graphic organizer. |
Table 3. UDL Strategies for Using Graphic Organizers to Further Minimize Lesson Barriers in “As the Tide Turns: Radio Broadcasts from the Front.”
Barrier |
UDL Strategy |
Choosing an appropriate graphic organizer for the task. |
Provide background information on graphic organizers and their use (in printed and digital format). |
Writing headings and brief explanations that go in the graphic organizer. |
Offer use of speech recognition, spell checker, and grammar checker when using graphic organizers; link from graphic organizer program to supports such as a thesaurus. |
Organizing the headings and brief explanations to connect the different pieces of researched information. |
Offer students the option of inserting images or sound clips to help organize their thoughts and information before beginning to write the text. Provide links to background information that may help with the task of connecting pieces of researched information. Provide models of completed graphic organizers. Provide templates customized to the student: some will be partially completed, some will provide tips on connecting information. |
The assigned task is too easy for some students. |
Provide students who need more challenge with a list of more complex graphic organizers. |
The assigned task is boring for some students. |
Offer students the option of incorporating images, audio, and video into their graphic organizer; show students how to customize their graphic organizer by using different colors and text styles. |
Recommendations for Implementation at the Classroom Level
Although UDL applications of graphic organizers already exist, they are admittedly hard to come by. Even with such models available, teachers face challenges in implementing them: the challenges of shifting away from traditional views of intelligence and traditional reliance on print media, the challenge of acquiring and mastering new technology, and the challenge of garnering support from the school system. The following sections offer recommendations that can help teachers overcome each one of these challenges.
Evidence for Effectiveness as a Learning Enhancement
Before investing in a new technology or instructional approach it is important to know for certain that there will be a sizeable return on the investment. Research studies are designed to put instructional tools and instructional methods to the test: evaluating their effectiveness and exploring the conditions that impact their use (see list below). As such, research studies are an invaluable resource. In the following sections, we discuss the evidence for the effectiveness of graphic organizers based on a survey of the research literature.
Factors Influencing Effectiveness
A wide variety of factors have been investigated for their influence on the effectiveness of graphic organizers for improving student learning. In this section, we review important findings that have emerged from this kind of analysis, starting with the issue of disability.
Disability
A fair number of studies have included students with disabilities in their investigations of graphic organizers. Successful learning outcomes have been demonstrated for both students with learning disabilities (LD) (Anderson-Inman, Knox-Quinn, & Horney, 1996; Boyle & Weishaar, 1997; Bulgren, et al., 1988; Gallego, et al., 1989; Gardill & Jitendra, 1999; Idol & Croll, 1987; Newby, Caldwell, & Recht, 1989; Sinatra, et al., 1984) and students without disabilities (Alvermann & Boothby, 1986; Bulgren, et al., 1988; Darch, et al., 1986; Willerman & Harg, 1991). Table 1 provides a basic description of these findings.
Table 1. Main research findings regarding the impact of graphic organizer use on students with disabilities.
Study |
Participants |
Focus & Impact |
Boyle & Weishaar (1997) |
Students with learning disabilities |
Students who were taught to generate cognitive organizers for use during reading and students who were taught to use expert-generated cognitive organizers during reading scored significantly higher than untaught peers on a comprehension test of literal and inferential comprehension. |
Bulgren, et al. (1988) |
Students with learning disabilities and students without learning disabilities |
When teachers used a concept teaching routine to present concept diagrams to students, students with and without learning disabilities significantly improved their performance on tests of concept acquisition and improved their note-taking skills. |
Gallego, et al. (1989) |
Students with learning disabilities |
Learning and rehearsing a semantic mapping procedure was associated with a significant increase in quantity and quality of in-class verbal contributions and a significant increase in the quality of student-written summaries. |
Gardill & Jitendra (1999) |
Students with learning disabilities; one student with neurological impairments, all experiencing difficulty with reading comprehension |
Direct instruction with an advanced story map procedure led to an improvement in students’ basal comprehension scores and story grammar comprehension. |
Idol & Croll (1987) |
Special education students with reading comprehension problems |
Training to use story-mapping procedures led to an improvement in most students’ ability to answer comprehension questions. |
Sinatra, et al. (1984) |
Students referred to a reading clinic |
Students who took part in instruction with a story mapping procedure answered significantly more comprehension questions correctly on average than students who took part in a directed reading approach. |
Meta-analysis that focused on the use of graphic organizers with LD students also showed a positive effect on learning outcomes. Dexter and Hughes’ (2011) meta-analysis of the use of graphic organizers with LD students showed they had positive gains on vocabulary and comprehension measures.
Grade Level
Graphic organizers have been investigated with student populations across a range of grade levels, including elementary, junior high, and high school. There are consistent although more modest effects for elementary populations (Moore & Readence, 1984; Dexter & Hughes, 2011; Dexter, et al., 2011; Ciullo, 2013).
Typically, in post-secondary educational settings, students are expected to acquire a large volume of academic knowledge and skills in a relatively short period of time through reading texts and from listening to lectures. Additionally, high-stakes mid-terms and final exams are the primary means for students to demonstrate their knowledge and skills. Students’ experience, and expertise with, using graphic organizers to facilitate reading and listening comprehension and to study for exams can be crucial to their success. On average, the largest effects of graphic organizers on learning from text have been reported for university populations (Moore & Readence, 1984).
Point of Implementation
Graphic organizers may be introduced as advance organizers (before the learning task) or as post organizers (after encountering the learning material). A review of the research from 1980–1991 (Hudson, Lignugaris-Kraft, & Miller, 1993) concludes that visual displays can be successfully implemented at several phases of the instructional cycle. Indeed, positive outcomes have been reported when graphic organizers are used as both advance (Boyle & Weishaar, 1997; Gallego, et al., 1989) and post (Alvermann & Boothby, 1986; Boyle & Weishaar, 1997; Gardill & Jitendra, 1999; Idol & Croll, 1987; Newby, et al., 1989; Sinatra, et al., 1984; Willerman & Mac Harg, 1991) organizers.
However, the precise point of implementation does appear to influence the degree of graphic organizers’ effectiveness. In their comprehensive review, Moore and Readence (1984) report that the point of implementation is a crucial factor in determining the magnitude of improvement in learning outcomes. When graphic organizers were used as a pre-reading activity, average effect sizes were small. In contrast, graphic organizers used as a follow-up to reading yielded somewhat large improvements in learning outcomes. Thus, efforts to improve learning outcomes may be more successful when graphic organizers are introduced after the learning material.
Instructional Context
In reviewing 11 years of research, Hudson, et al. (1993) note that positive outcomes for curricular enhancements require the use of effective teaching practices. Merkley and Jefferies (2001) note that, “It is important, however, that GO planning extend beyond construction of the visual to the deliberate consideration of the teacher’s strategies…to accompany the visual.” Thus, instructional context is another determinant of the effectiveness of graphic organizers for improving learning.
Without teacher instruction on how to use them, graphic organizers may not be effective learning tools (Carnes, et al., 1987; Clements-Davis & Ley, 1991). Graphic organizers can successfully improve learning when there is a substantive instructional context such as explicit instruction incorporating teacher modeling (Boyle & Weishaar, 1997; Gardill & Jitendra, 1999; Idol & Croll, 1987; Willerman & Mac Harg, 1991) and independent practice with feedback (Boyle & Weishaar, 1997; Gardill & Jitendra, 1999; Idol & Croll, 1987), strategy instruction (Anderson-Inman, et al., 1996; Boyle & Weishaar, 1997; Darch, et al., 1986; Scanlon, Deshler, & Schumaker, 1996), story mapping (Gardill & Jitendra, 1999; Idol & Croll, 1987), semantic mapping (Gallego, et al., 1989), and concept teaching routines (Bulgren, et al., 1988). Most successful interventions include, at a minimum, a teacher-led introduction describing the purpose of the graphic organizer and setting the reading purpose.
In the absence of systematic study of the role of instructional context, it is difficult to identify with confidence specific aspects that are tied to success. However, in our review an interactive/collaborative approach involving teacher modeling, student-teacher discussion, and practice with feedback appeared to be consistently correlated with learning improvement (Alvermann & Boothby, 1986; Bulgren, et al., 1988; Gardill & Jitendra, 1999; Idol & Croll, 1987; Scanlon, et al., 1996). Thus, contexts that provide opportunity for student input and interaction with the teacher and/or one another (Darch, et al., 1986; Gallego, et al., 1989) may be especially effective.
Also useful are Merkley and Jefferies’ (2001) specific suggestions for teaching with graphic organizers. Their guidelines include verbalizing relationships between the concepts represented within an organizer, providing opportunities for student input, connecting new information to past learning, making reference to upcoming text, and reinforcing decoding and structural analysis.
A relatively new area of research is the investigation of digital technology-based methods for presenting graphic organizer instruction. Digital-based graphic organizers can facilitate meaningful learning by enabling students to create and edit visual representations of information and alternate between different views of the same information (Novak, 2006). The flexibility and productivity affordance of digital graphic organizers also serves as an evaluation tool. Students graphical representations of content can be evaluated to identify understandings, misconceptions, and competencies (Novak, 2006). Ciullo’s (2013) meta-analysis of digital-based graphic organizers with LD students showed high effect sizes in social studies measures and moderate effects in written expression and reading comprehension measures.
Similarly, Herl, et al. (1999) tested the effectiveness of two computer-based knowledge mapping systems in a population of middle and high school students. Students either worked individually using an artificial web space to augment and revise knowledge maps or networked with one another across computers to collaboratively construct maps. Knowledge mapping scores (determined by comparison to expert maps) were significantly improved for individuals working individually to elaborate maps but not for students involved in collaborative construction. These findings indicate that a digital-based system can be successfully used to instruct students on how to develop concept maps. They also suggest that web searching methods may improve students’ abilities to develop sophisticated maps. Student collaborative approaches, however, may be less effective.
Carnes, et al. (1987) constructed computerized advance organizers to help introduce high school physics students to microcomputer physics tutorials but were unable to establish a significant improvement in learning rate, retention, or performance on a teacher-made achievement test. However, the lack of effect is likely attributable to the absence of teacher introduction of or training with the organizers.
Findings by Anderson-Inman, et al. (1996) found substantial variability in the adoption of computer-based graphic organizer study strategies. Some students became quite skilled and independent with these strategies, while others developed only basic skills and remained reluctant in their use. Their finding that differences in adoption level were correlated with reading test and intelligence scores suggests that it may be possible to predict levels of user proficiency.
Successful learning outcomes can be obtained in a variety of classroom settings, including special education classrooms (Anderson-Inman, et al., 1996; Boyle & Weishaar, 1999; Gardill & Jitendra, 1999) mainstream classrooms (Alvermann & Boothby, 1986; Bulgren, et al., 1988; Darch, et al., 1986; Willerman & Mac Harg, 1991) and one-on-one instruction (Idol & Croll, 1987; Newby, et al., 1989; Sinatra, et al., 1984). However, the relative ease of implementation is an important determinant of this success (Novak, 1980; Canas, 2003; Novak, 2006). Some instructional contexts that have been successful in research studies are unfortunately difficult for teachers and/or students to implement. For example, Scanlon, et al. (1996) developed—collaboratively with teachers—a 5-step strategy and sub-strategy for helping students in academically diverse classes to process information and put it into a graphic organizer for studying and/or writing. Teachers in the study implemented the prescribed teaching behaviors to much less of a degree than they had promised and expressed dissatisfaction with the lack of fit with their regular teaching routine. Students trained with the strategy performed better than controls on a strategy performance test, but only to a modest degree. They were at best ambivalent about the utility of the strategy for improving learning. Moore and Readence (1984) make similar observations in their meta-analysis, noting frequent reports that students were unable to appreciate the value of graphic organizers to learning and felt that these tools were out of place in the current instructional context. To draw more solid conclusions about the best ways to implement graphic organizers, more systematic investigations of the role of instructional context are needed.
Summary
Research studies show that graphic organizers are effective enhancements for students with and without learning disabilities. Successful learning outcomes are contingent on certain other factors (see list below). Important considerations are grade level, point of implementation, instructional context, and ease of implementation. Thus, smartly implemented, graphic organizers have the potential to positively impact learning by offering teachers a means to improve all students’ reading comprehension, vocabulary knowledge, and learning across academic subjects.
Important Factors Influencing the Effectiveness of Graphic Organizers
- Grade level: the largest effects have been reported for university populations; consistent but more modest effects have been reported for students in elementary grades.
- Point of implementation: graphic organizers generate larger improvements in learning when used as a follow-up to reading rather than a pre-reading activity.
- Instructional context: graphic organizers can be effective learning and evaluation tools when implemented within a substantive instructional context, particularly an interactive/collaborative approach involving teacher modeling, student-teacher discussion, and practice with feedback.
- computer-based graphic organizer instruction can be successful if there is thorough teacher introduction of and training on graphic organizer use.
- graphic organizers can be successfully used in a variety of classroom settings including the mainstream classroom, special education classroom, and in a one-on-one context.
The next section of this report introduces the reader to the theory and research behind Universal Design for Learning (UDL). We then investigate the links and connections between UDL and graphic organizers. Additionally, we identify methods and materials that may be used to support the implementation of graphic organizers in concert with the principles of UDL. Finally, a set of guidelines for UDL implementation are provided including a listing of web resources to provide further information on the concepts presented in this report.
Conclusion
As more and more teachers begin to explore UDL in their classrooms, they will begin to augment books and lectures with new technologies. Graphic organizer software is undoubtedly a technology that can help teachers succeed at implementing UDL and developing curricula that make information and learning more accessible. Although these teachers will undoubtedly encounter challenges, models and resources continue to build—and along with them builds the opportunity to realize the potential of graphic organizers and UDL in the classroom.